Track
A track keeps various results of ML training or experiments, including the parameters, metrics, console logs, and any logged files or data. It also enables visualization of the results with TensorBoard.
Create a Track
A track could be created from a lab job or from a pipeline run.
Create a track from a lab
In the lab page, click on the Submit menu item.
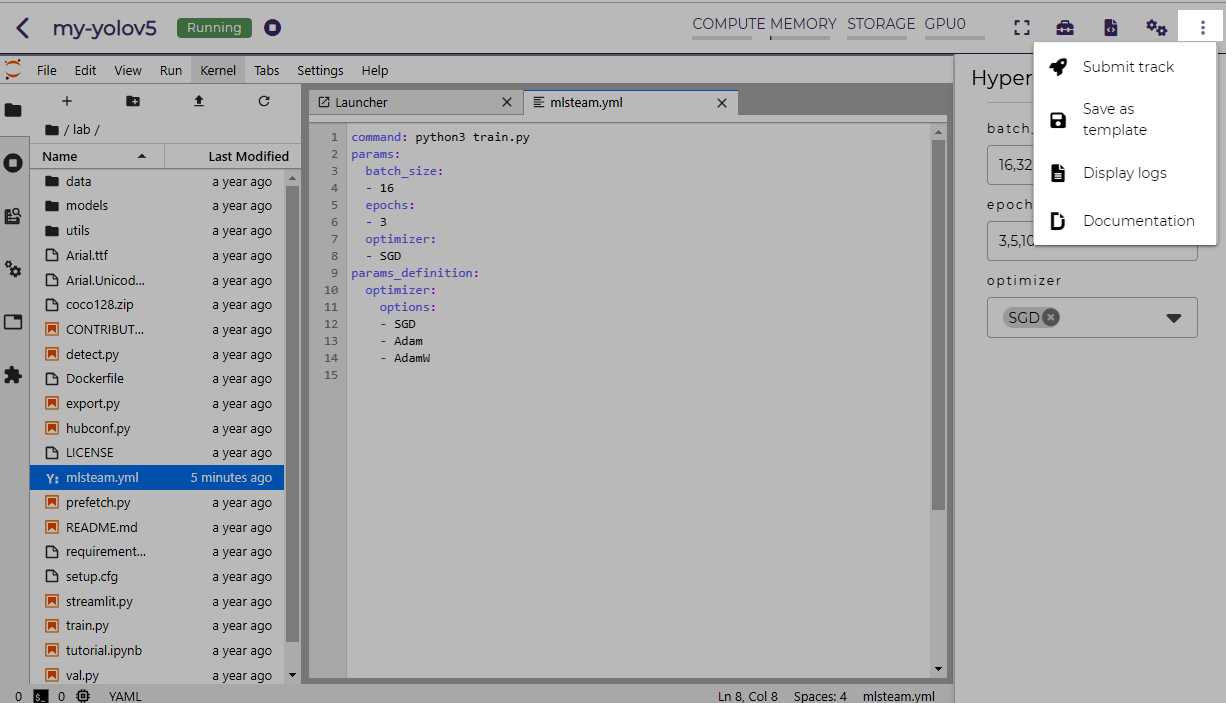
Click on the SUBMIT button.
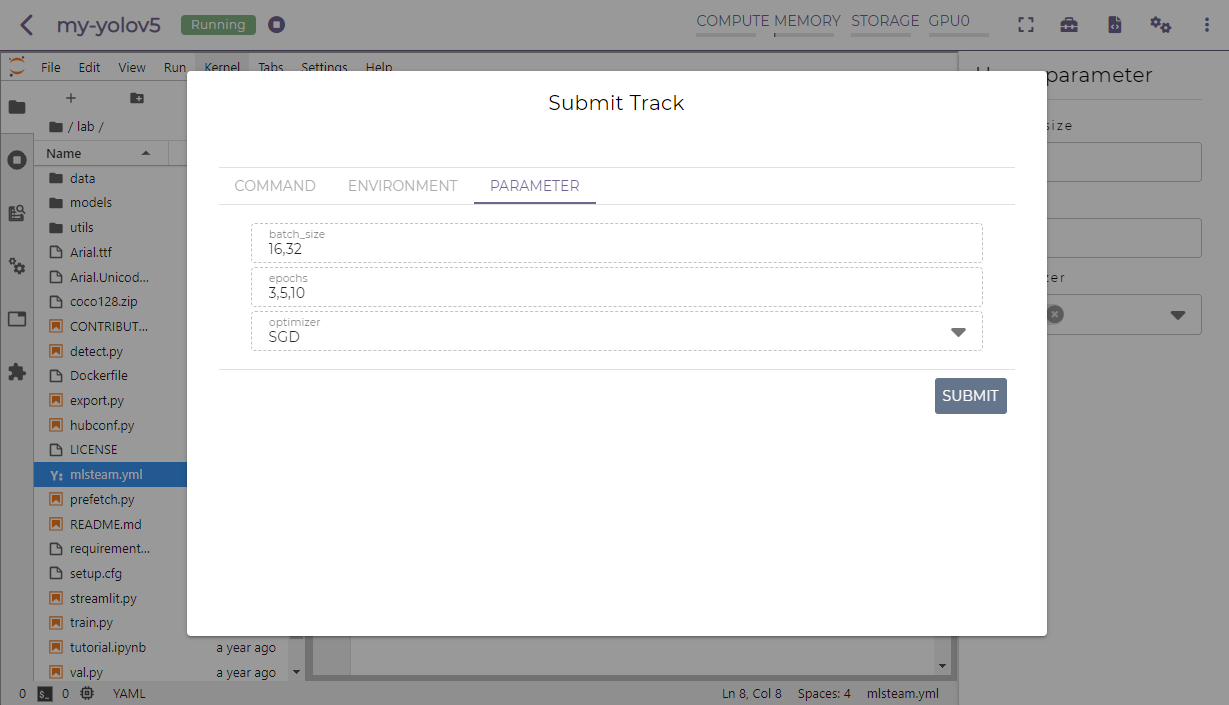
A new browser window will open, which shows the submitted jobs as tracks.
Note
One or more tracks will be created depending on the hyperparameter settings.
Create a track from a pipeline run
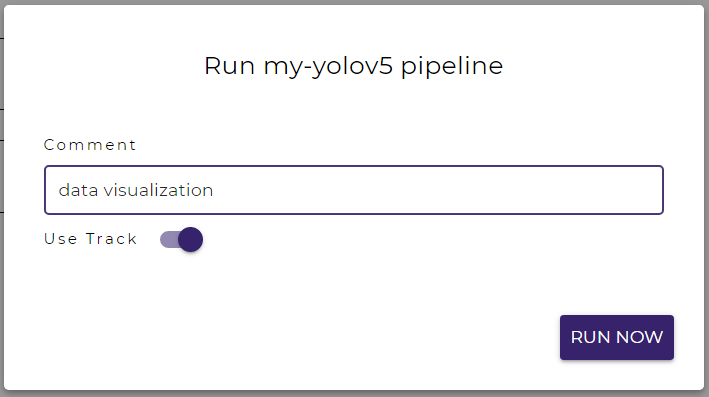
In the pipeline page, click on the RUN PIPELINE button.
Toggle on Use Track.
Click on the RUN NOW button.
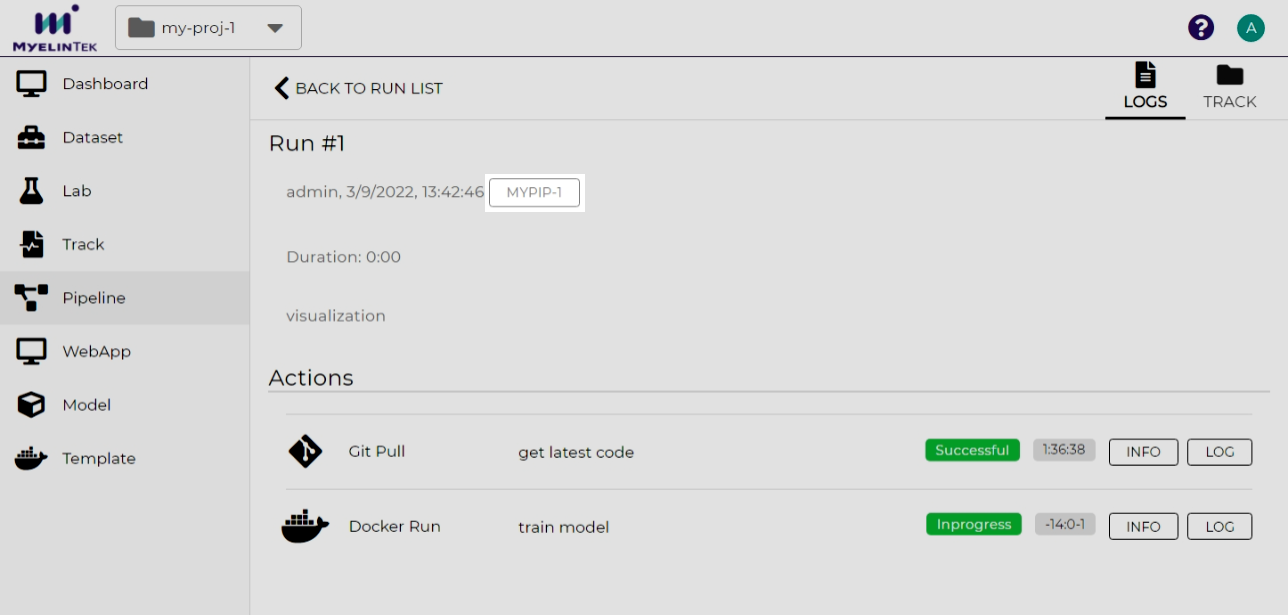
A button that opens the track will be displayed.
Note
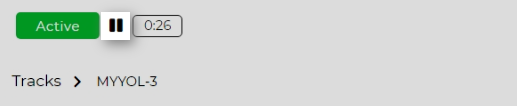
There is a quick way to stop the underlying active lab job or pipeline run associated with the track. Simply click on the stop button in the track page.
Track Your Training
Hyperparameter values and console logs are logged by default in a track. You could also fetch the hyperparameters and log more information (such as training and testing metrics) programmatically through the MLSteam Client library.
Note
The MLSteam Client library is available in most of the built-in lab templates. To install the library in customized environments:
pip install mlsteam-client
First, initialize the client:
import mlsteam
from mlsteam import stparams  # optional, for hyperparameter fetching

track = mlsteam.init()
On submitting a track in hyperparameter tuning, MLSteam writes the combination of hyperparameter values in the mlsteam.yml file, which could be read by the client.
To fetch hyperparameter values:
stparams.get_value(parm_name, parm_default_val)
- parm_name (str)
parameter name
- parm_default_val (Any)
default value when the parameter is undefined
The following sets the default argument in a training program.
parser = ArgumentParser()
parser.add_argument('--batch', type=int, default=stparams.get_value('batch', 128))
To log a single value (aka. scalar):
track[log_name] = log_value
- log_name (str)
logging location. You could optionally use slashes
/to organize the parameters in directories.- log_value (int, float, str)
logging value
The following logs the language model building settings.
track['model/name'] = 'small_bert'
track['model/layer'] = 4
track['model/hidden'] = 256
To log a series:
track[log_name].log(log_value)
- log_name (str)
logging location. You could optionally use slashes
/to organize the parameters in directories.- log_value (int, float, str)
logging value
MLSteam timestamps each series logging in the format of
timestamp, log_value.The following logs the model training metrics for each epoch with PyTorch Lightning.
class MyCallback(Callback):
    def on_train_epoch_end(self, trainer, pl_module, result):
        logs = trainer.logged_metrics
        # ['loss/val', 'acc/val', 'epoch', 'loss/train', 'acc/train']
        for key, value in logs.items():
            track[key].log(value)
To log a series for visualization:
track[log_name].log(log_value)
- log_name (str)
logging location ended with
.chart. You could optionally use slashes/to organize the parameters in directories.- log_value (int, float, str)
logging value.
To log a single series, use an integer, a float, or a string (without commas) value.
To log multiple series together, use a comma-separated string
's1_val, s2_val, ...'to denote unnamed series, or use a JSON object string'{"s1_name": s1_val, "s2_name": s2_val, ...}'to denote named series.Note
Unnamed series will be assigned names
y1,y2,y3, etc.X-axis will be timestamps unless there is a series named
epoch.The following demonstrates logging for various kinds of chart display.
# a line chart of series (y1) with timestamp as x-axis
track['chart_single.chart'].log(123)

# a line chart of series (y1, y2, and y3) with timestamp as x-axis
track['chart_mutiple.chart'].log('123, 456, 789')

# a line chart of series (loss and accuracy) with timestamp as x-axis
track['chart_mutiple_named.chart'].log(json.dumps({'loss': 0.35, 'accuracy': 0.59}))

# a line chart of series (s1 and s2) with epoch number as x-axis
track['chart_mutiple_epoch.chart'].log(json.dumps({'epoch': 1, 's1': 123, 's2': 456}))
View Logged Data
To view logged data:
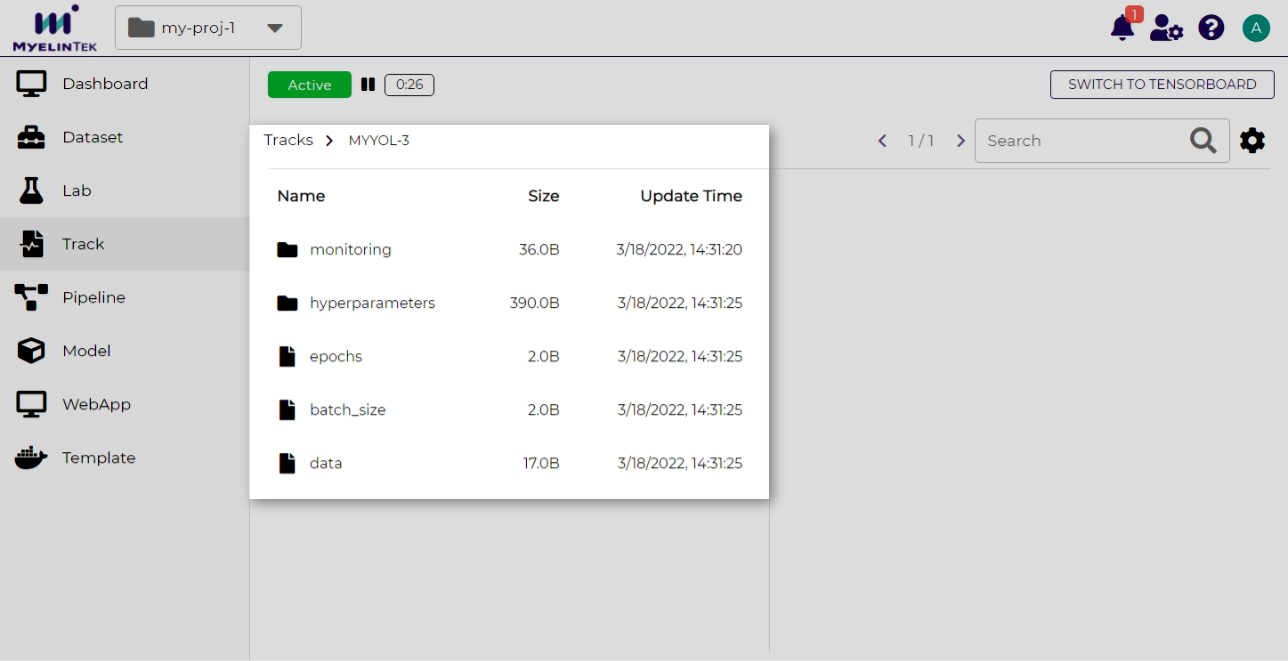
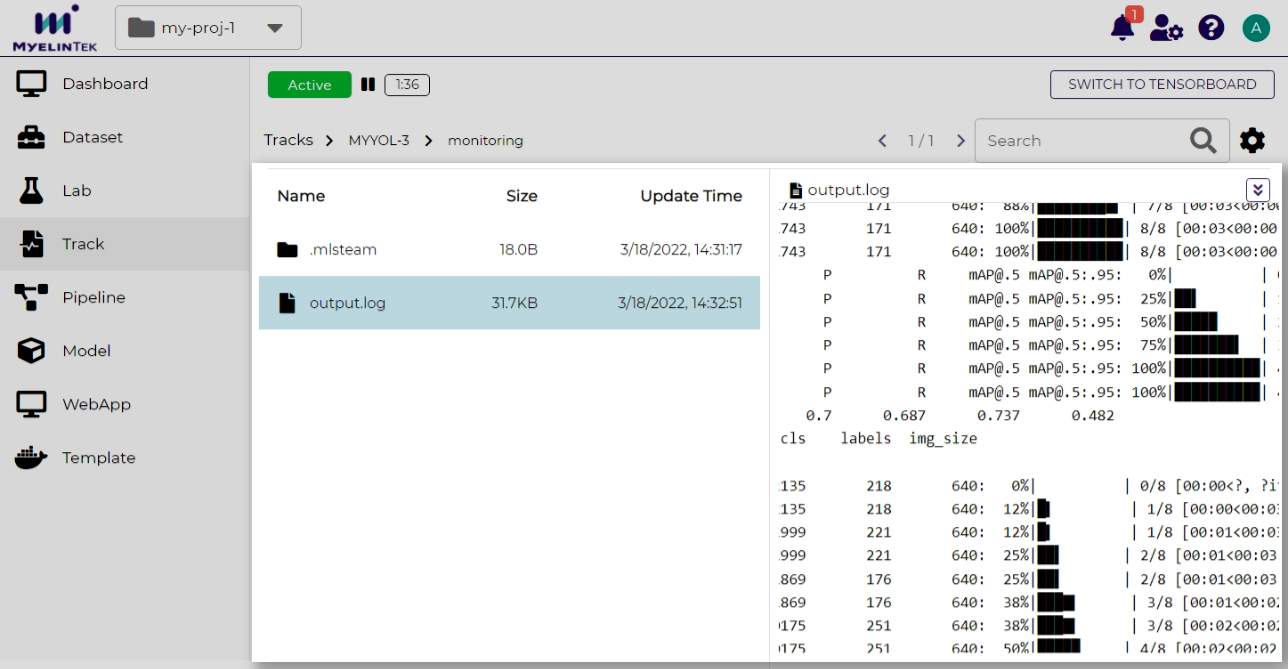
Go to the track page by clicking on the track item.
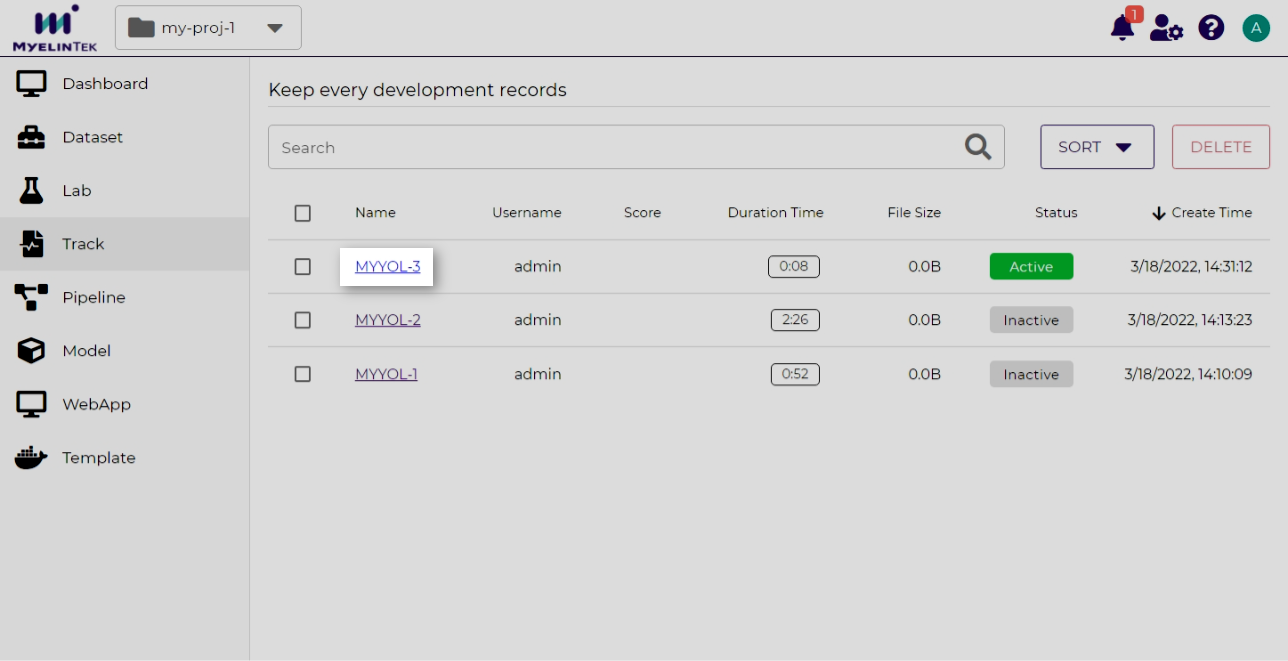
All kinds of the logged data (such as parameters, metrics, console logs, and normal files) are organized in directories. You could view them in a unified way.
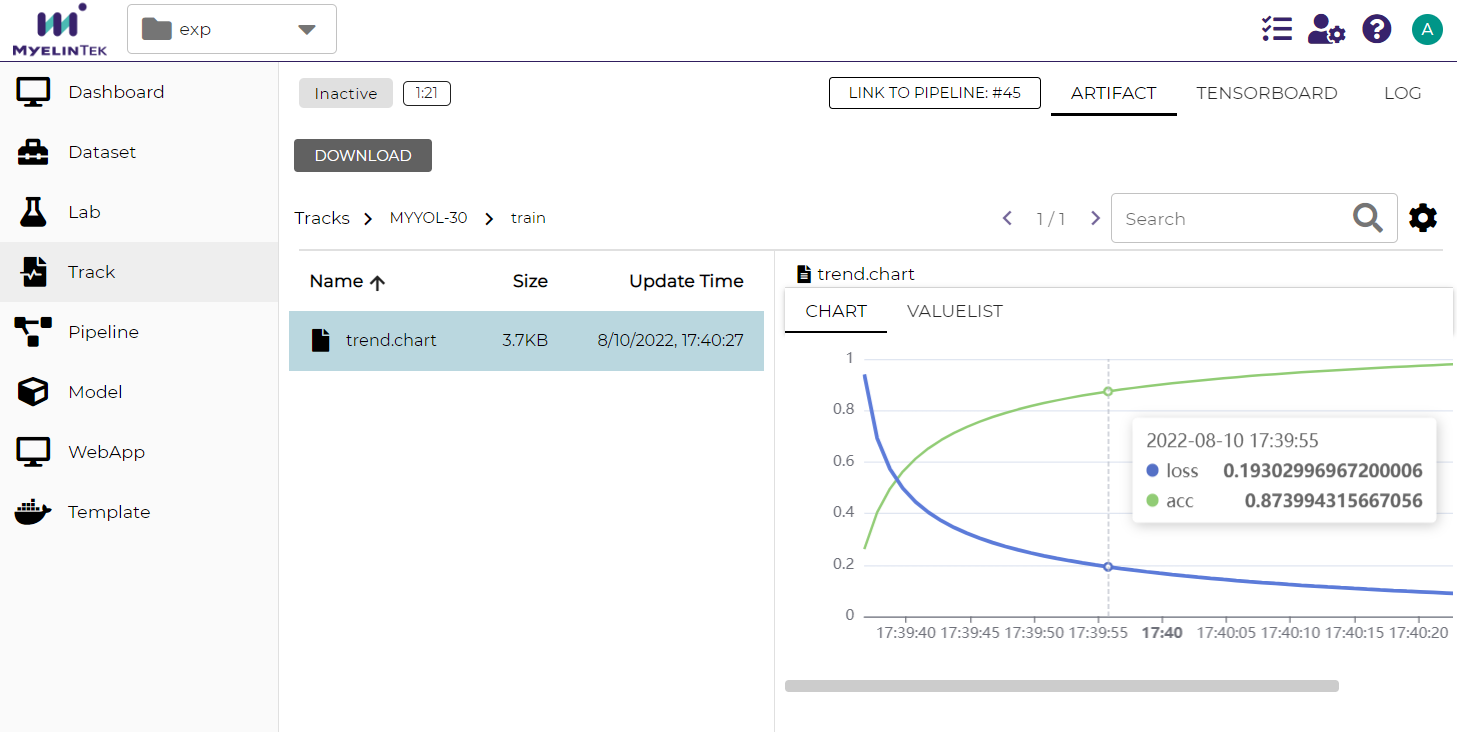
Visualization for series logged with MLSteam client:
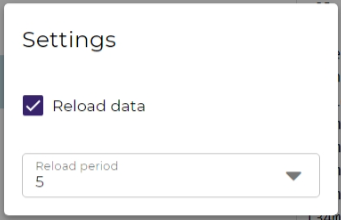
You may also keep the view updated periodically by clicking on the settings button on the top-right corner

and then enabling the Reload data checkbox. The reload period is in seconds.
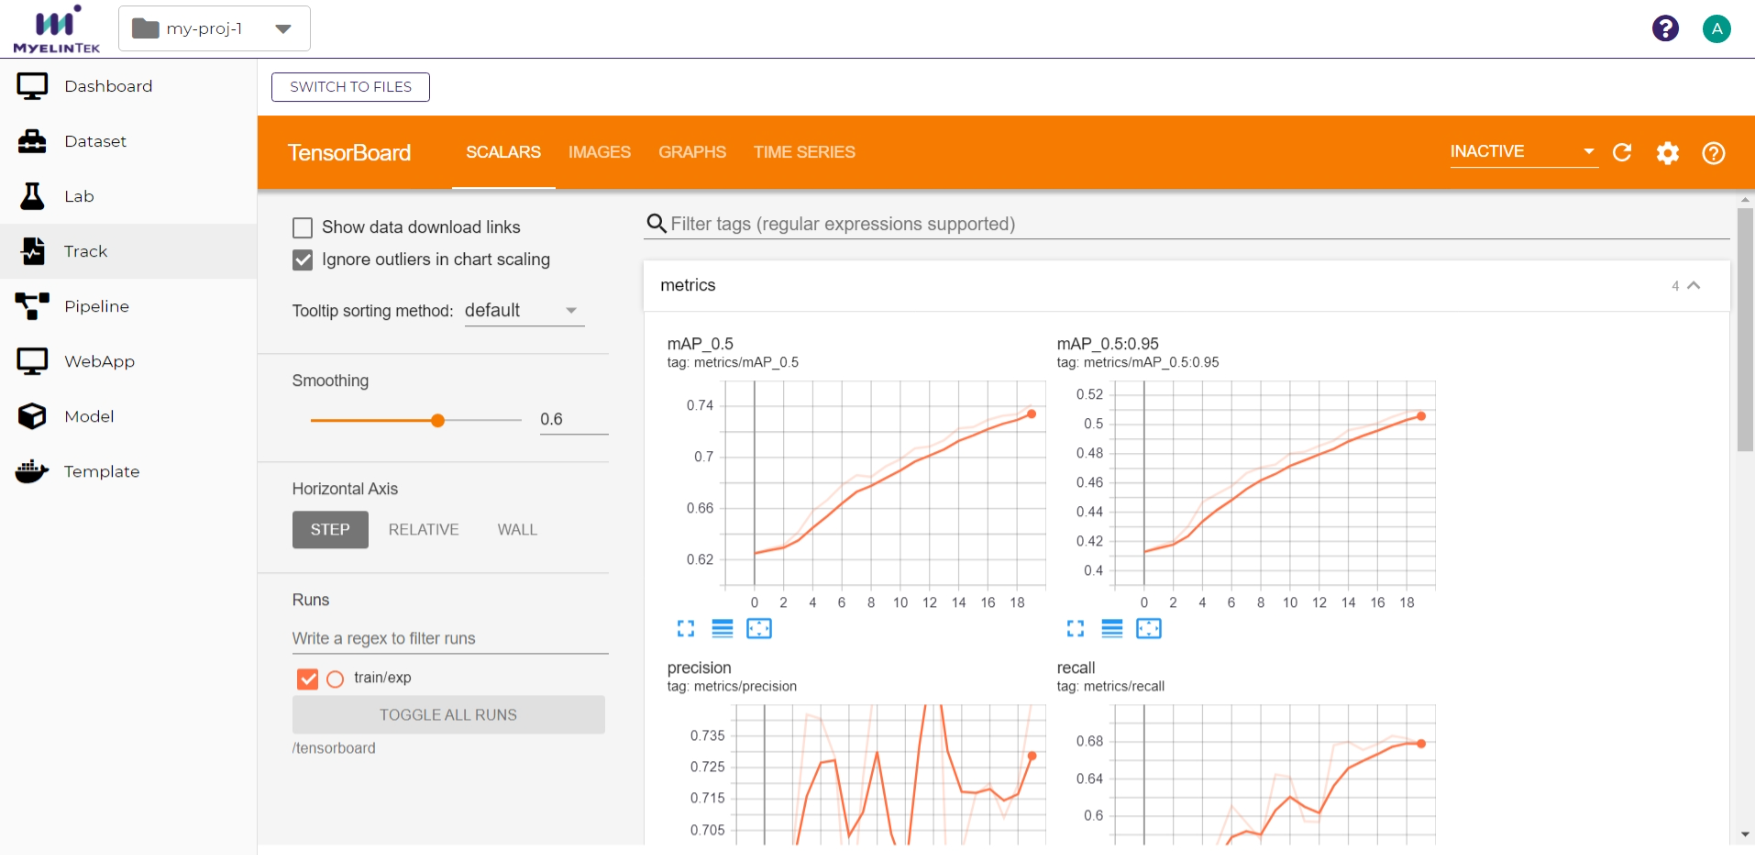
Visualize Data with TensorBoard
To view multi-dimensional data displayed in TensorBoard:
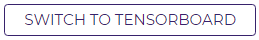
Click the SWITCH TO TENSORBOARD button in the top-left corner.
TensorBoard will show up in a few seconds.
Note
Refer to the TensorBoard Website for visualization operations.
Delete a Track
To delete a track:
Select the track to delete.
Click on the DELETE button.
Click on the OK button.