Quick Start: MLOps
This tutorial will show you how to:
Start a machine learning pipeline for YOLOv5 object detection.
Visualize the YOLOv5 model training results to see the performance.
Preparation
Make sure there is a project for you to run a pipeline. Refer to Quick Start: Machine Learning Lab for more details on preparation.
Create a YOLOv5 Pipeline
We will start a pipeline to train and run a YOLOv5 model.
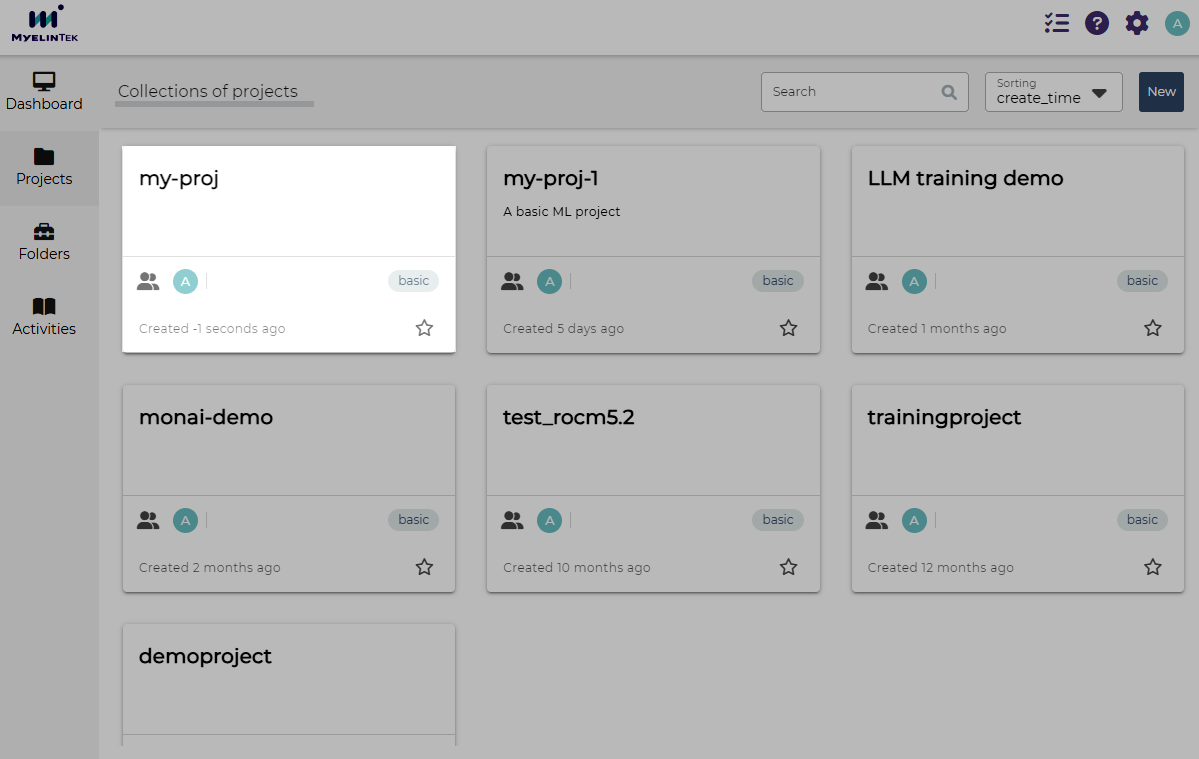
Go to the project page by clicking on the project card.
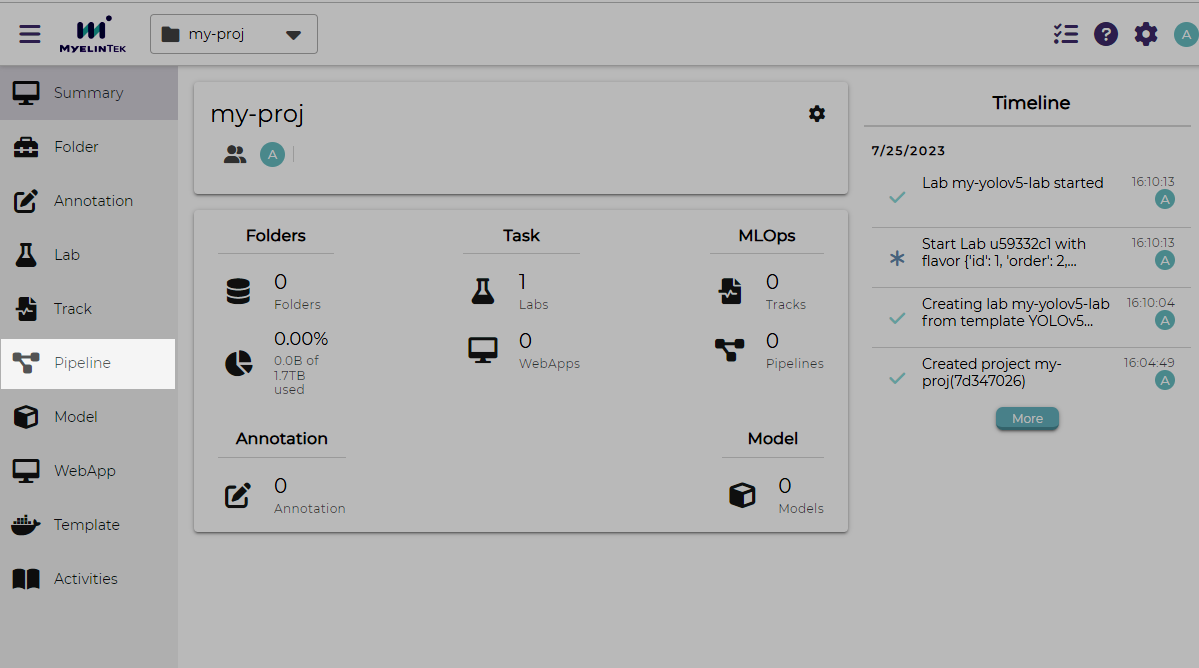
Click on the Pipeline item in the left menu.
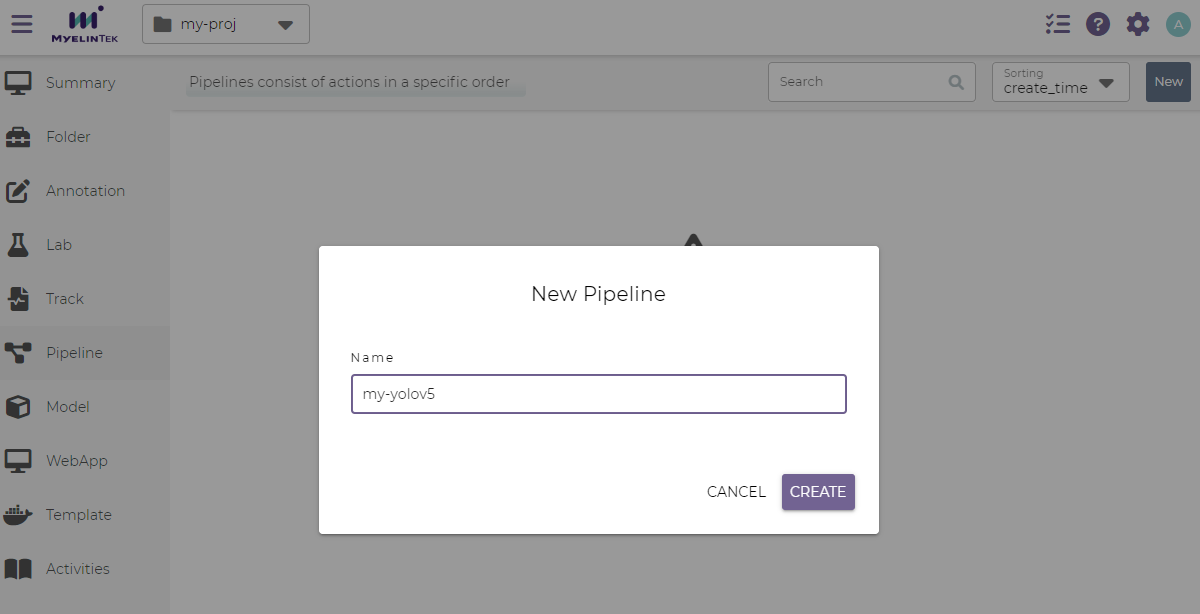
Click on the NEW button.

In the new project dialog, input the following fields:
Name:
my-yolov5
Click on the CREATE button.
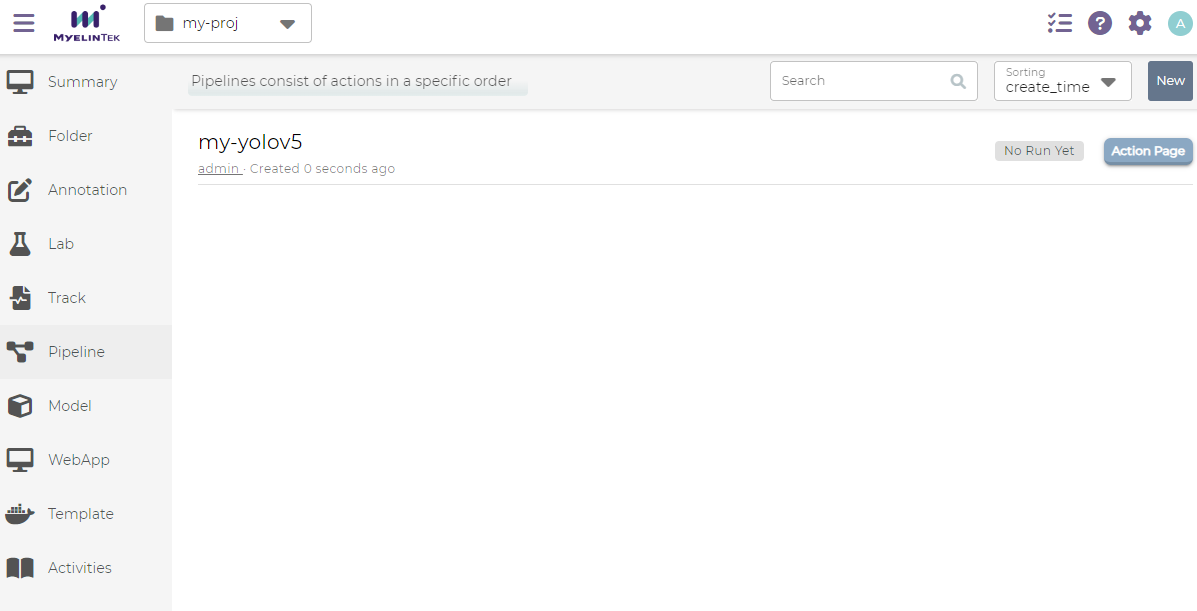
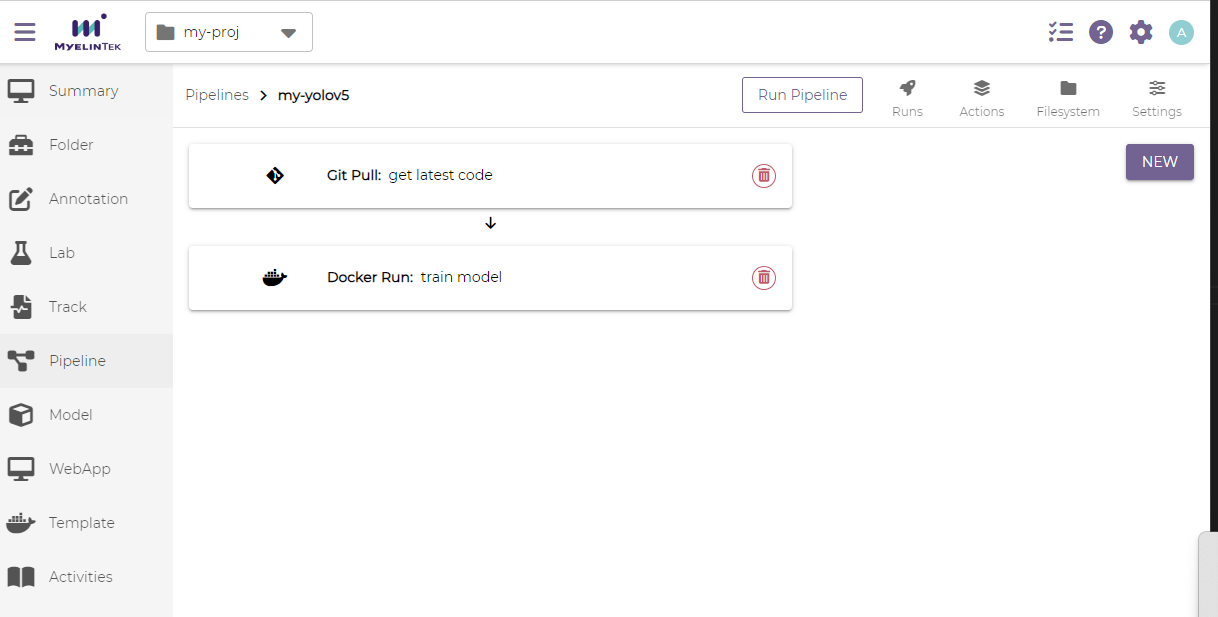
The newly created pipeline is now displayed with status Not Run Yet.
Define the Pipeline Procedure
We will define an MLOps pipeline consisting of two actions: (1) to download the latest YOLOv5 code, and (2) to train the YOLOv5 model.
Go to the actions page by clicking on the Action Page button.
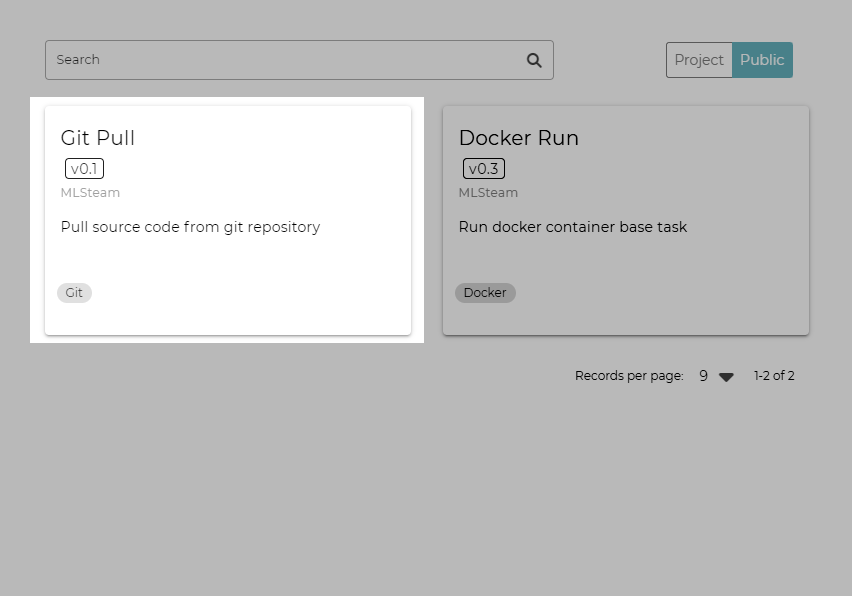
Click on the NEW button.
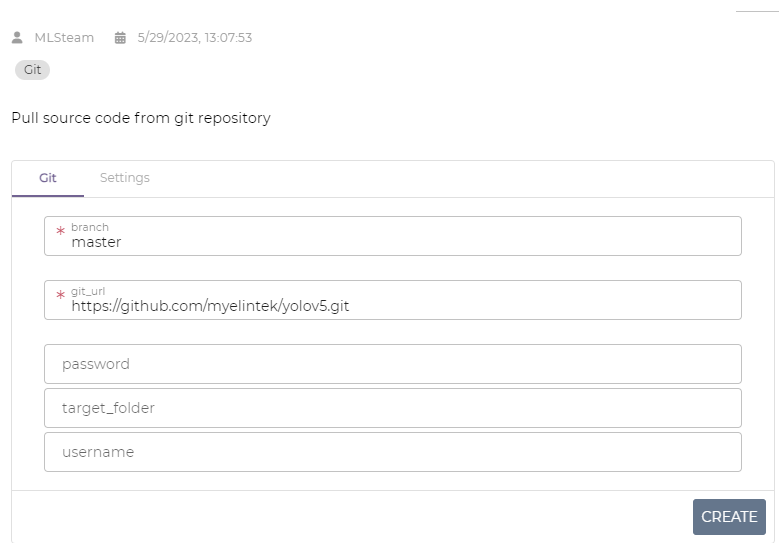
In the new action dialog, click on the Git Pull action.
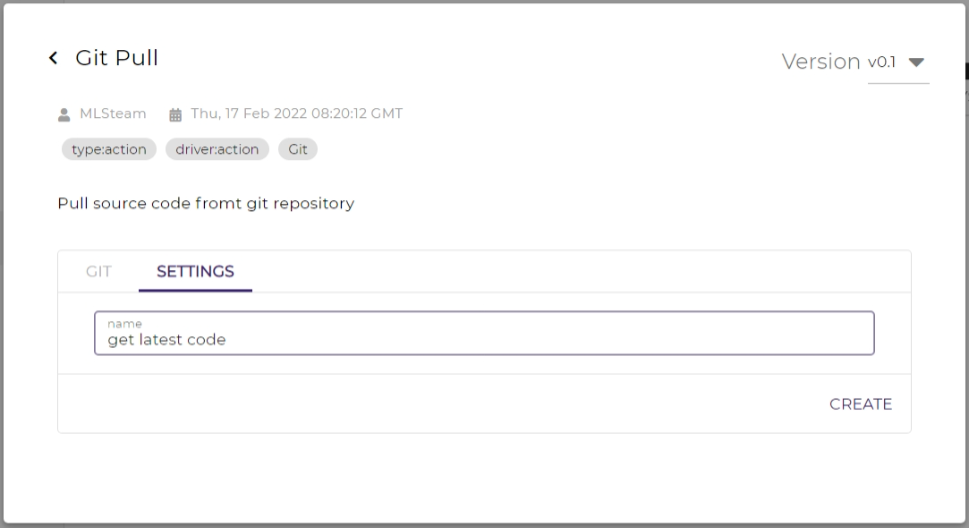
In the action settings dialog, input the following field in the Git section:
Input the following field in the Settings section:
Action name:
get latest code
Click on the CREATE button. The code-downloading action is now defined.
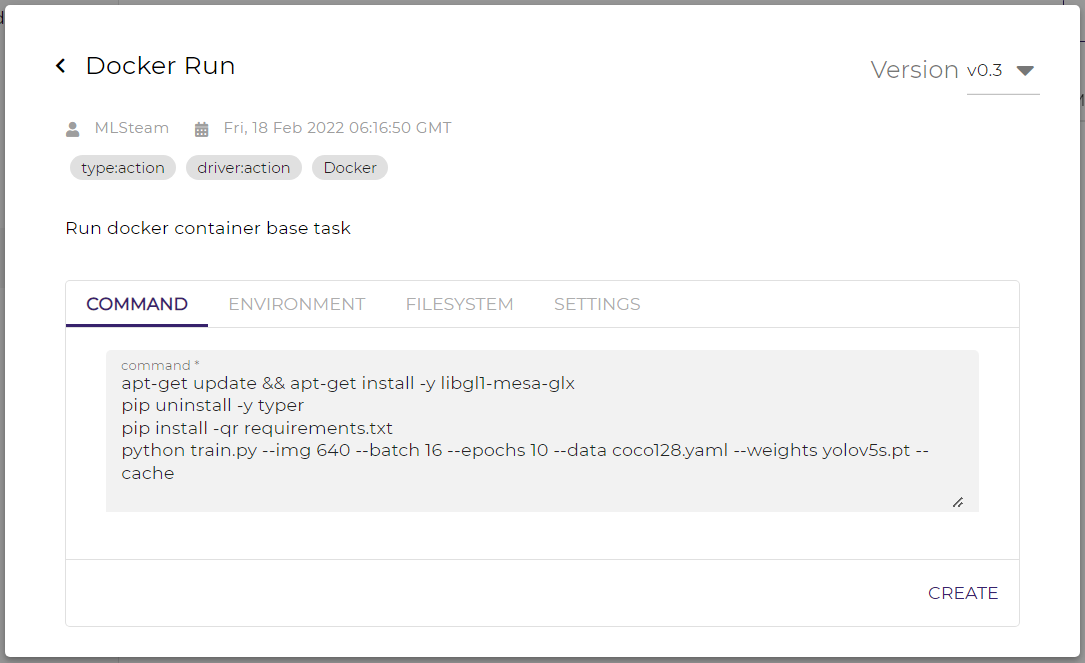
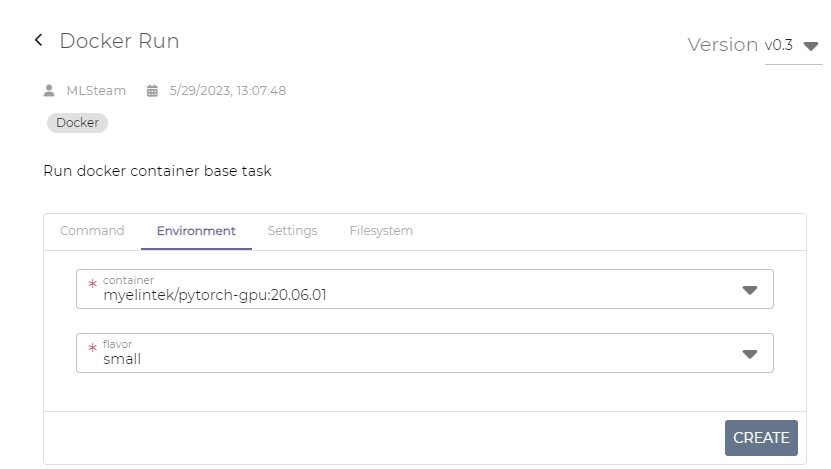
Define the model-training action. Click on the NEW button, select the Docker Run action template, and fill in the following fields:
In the command section:
Command:
apt-get update && apt-get install -y libgl1-mesa-glx
pip uninstall -y typer
pip install -qr requirements.txt
python train.py --img 640 --batch 16 --epochs 10 --data coco128.yaml --weights yolov5s.pt --cache
In the environment section:
Container:
myelintek/pytorch-gpu:20.06.01Flavor:
small
Note
The actual container version number may differ.
In the settings section:
Action name:
train model
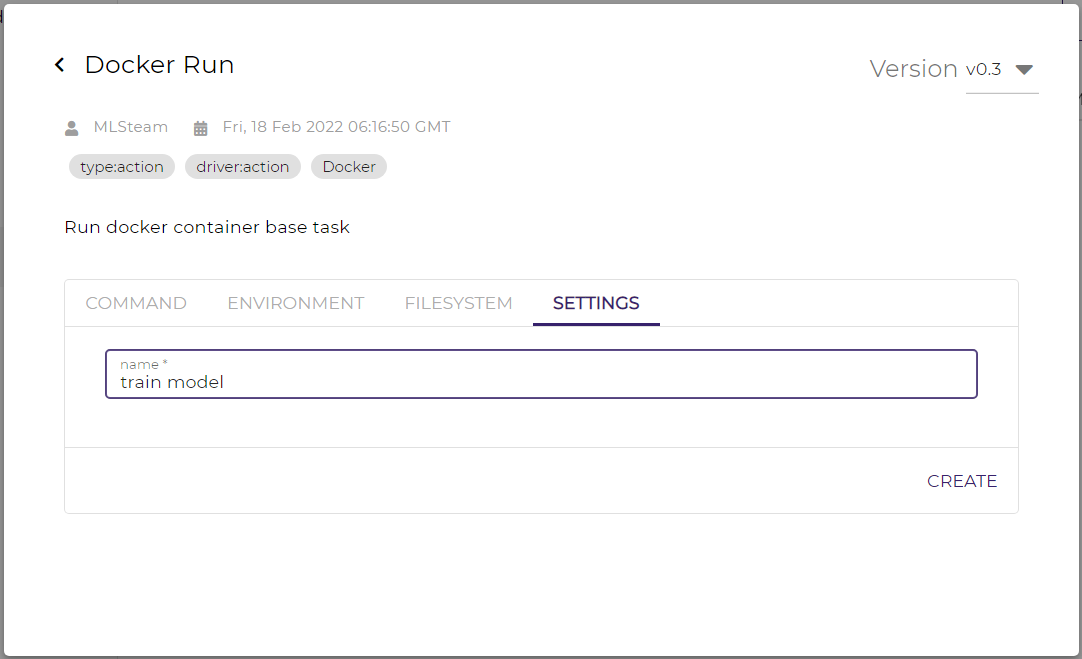
Click on the CREATE button.
Now, we have defined all the actions and are ready to run the pipeline.
Run the Pipeline
To run the Pipeline:
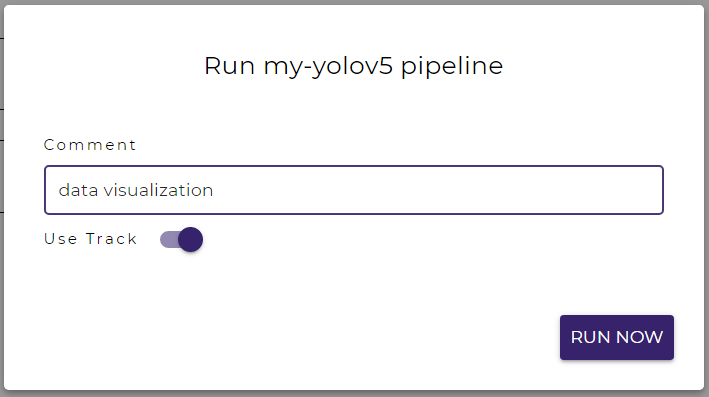
Click on the RUN PIPELINE button on the top.
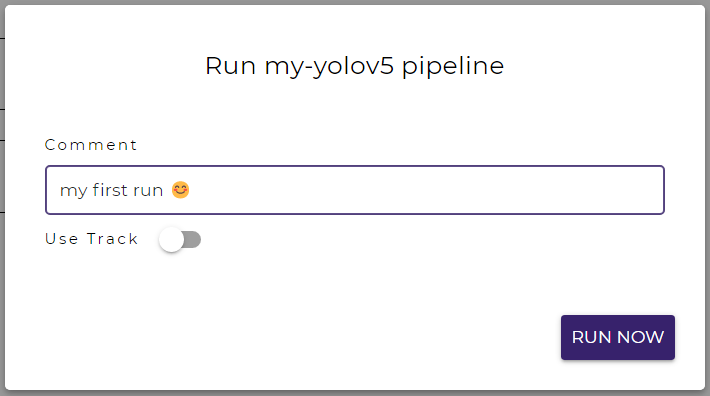
Write a comment to denote this run or leave it blank.
Click on the RUN NOW button. The pipeline will start to run in a few seconds.
Note
A pipeline run may be delayed for a while if the system is busy on processing other labs or pipeline runs.
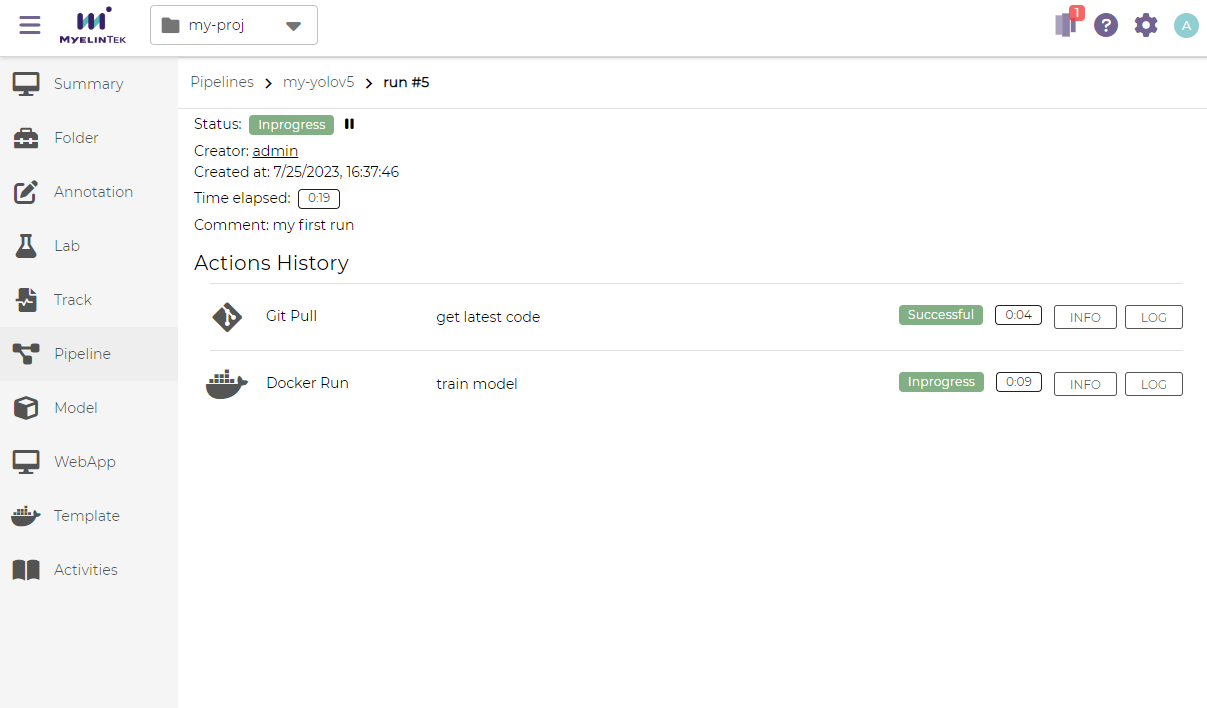
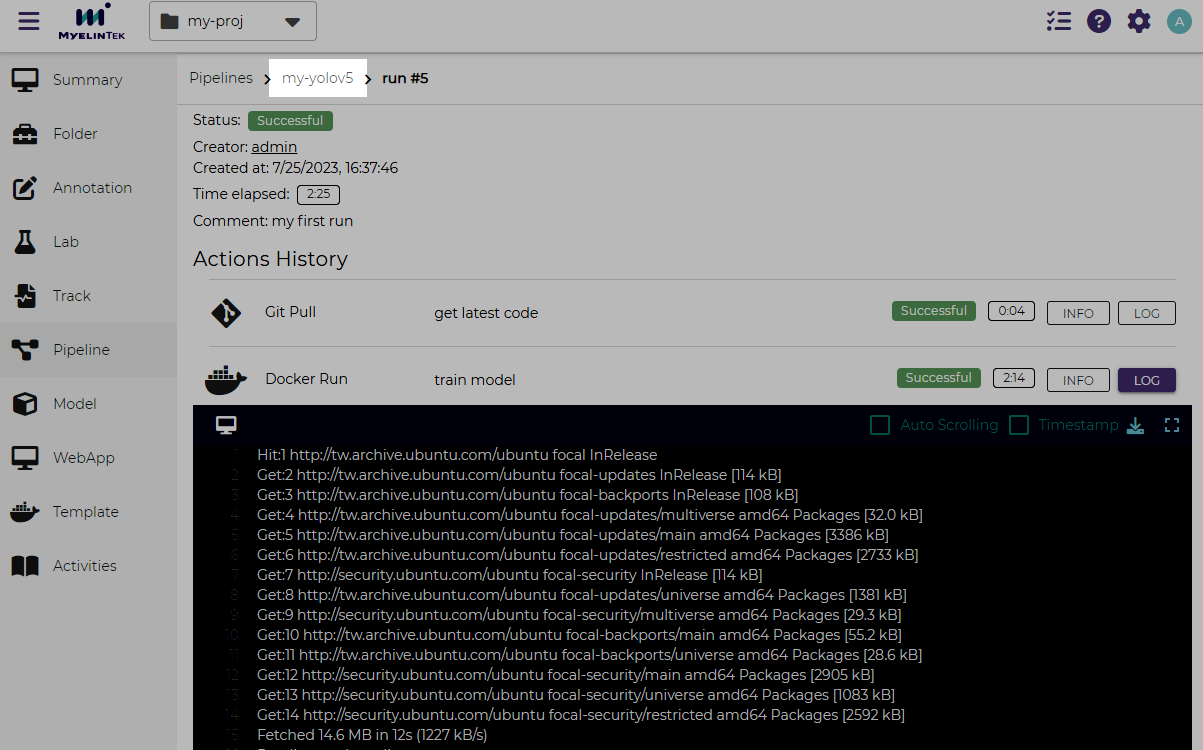
We could see the overall pipeline run information and the status in the pipeline run page.
The immediate outputs of a pipeline action could be observed by clicking on the LOG button.
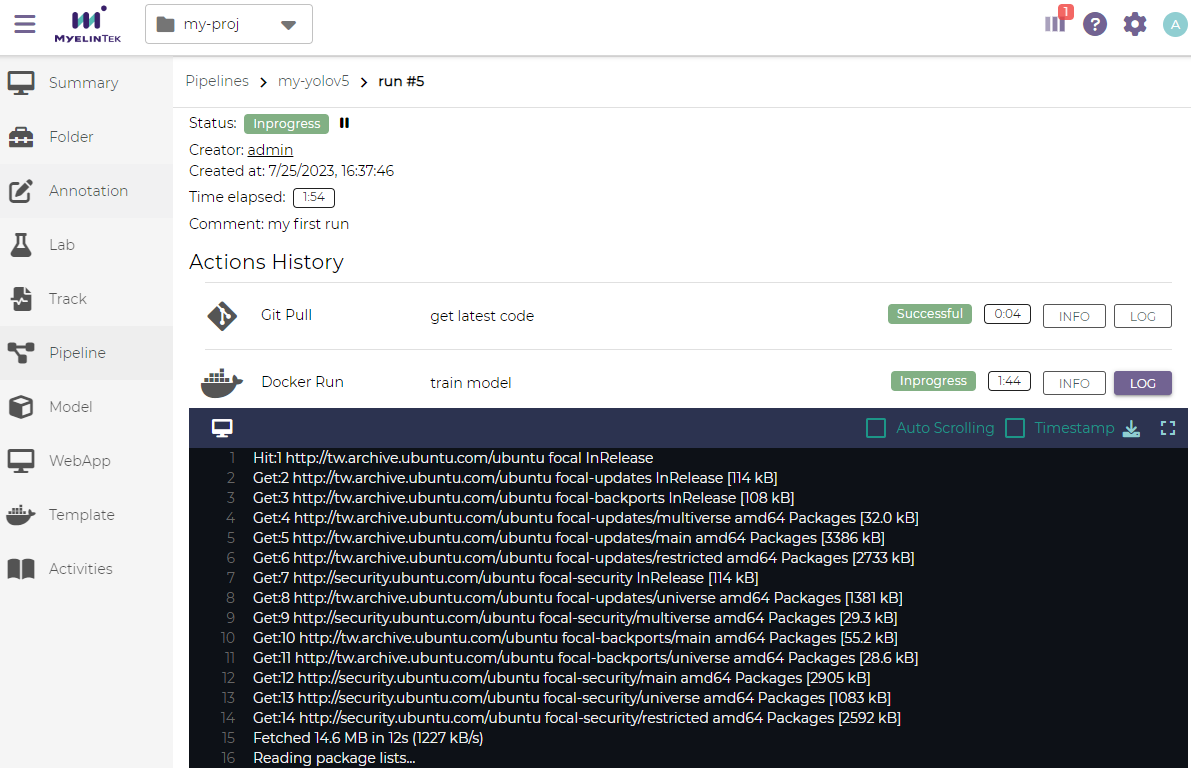
We could also view the outputs in full screen by clicking on the fullscreen button. Press Esc to exit the full screen mode.
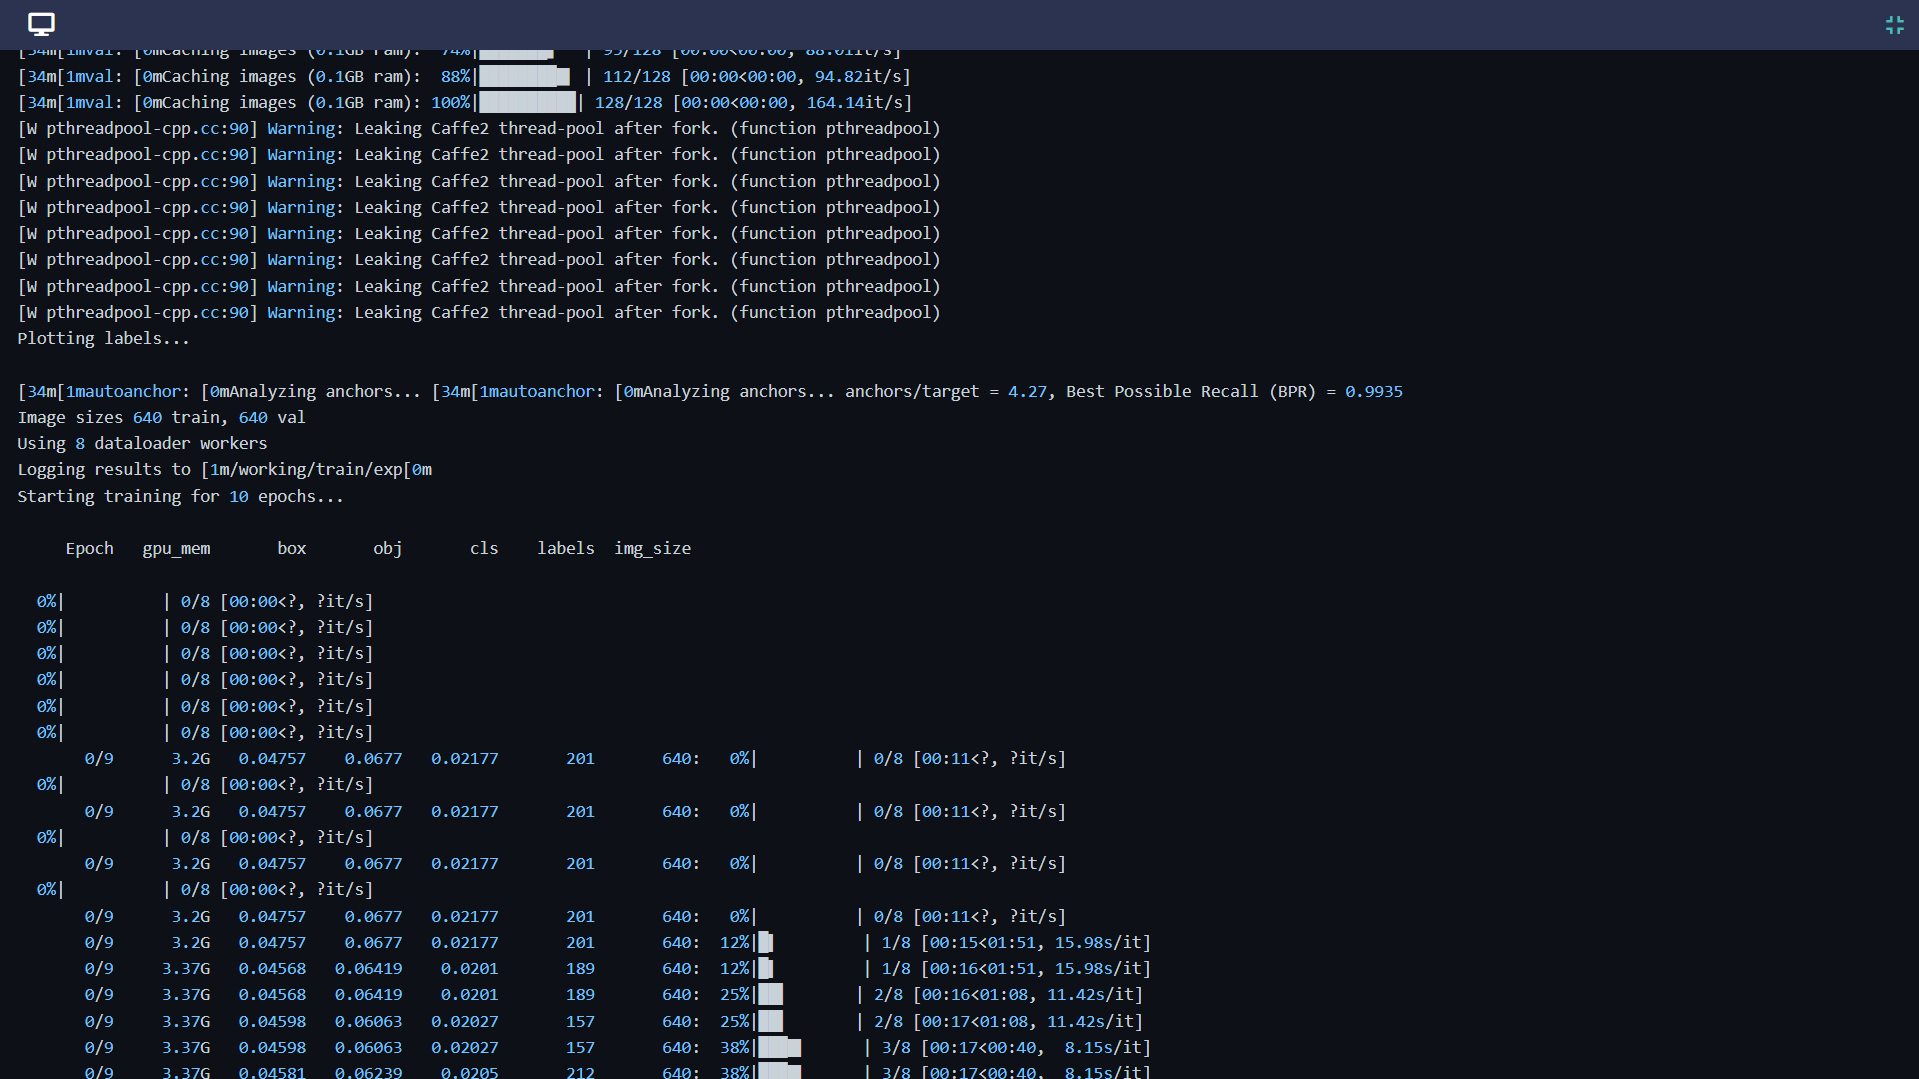
The model validation results could be found in the last part of the outputs, something like:
Validating /working/train/exp/weights/best.pt...
Fusing layers...
Model Summary: 213 layers, 7225885 parameters, 0 gradients, 16.5 GFLOPs

            Class     Images     Labels          P          R     mAP@.5 mAP@.5:.95:   0%|          | 0/4 [00:00<?, ?it/s]
            Class     Images     Labels          P          R     mAP@.5 mAP@.5:.95:  25%|██▌       | 1/4 [00:00<00:02,  1.30it/s]
            Class     Images     Labels          P          R     mAP@.5 mAP@.5:.95:  50%|█████     | 2/4 [00:02<00:02,  1.10s/it]
            Class     Images     Labels          P          R     mAP@.5 mAP@.5:.95:  75%|███████▌  | 3/4 [00:03<00:01,  1.17s/it]
            Class     Images     Labels          P          R     mAP@.5 mAP@.5:.95: 100%|██████████| 4/4 [00:04<00:00,  1.05s/it]
            Class     Images     Labels          P          R     mAP@.5 mAP@.5:.95: 100%|██████████| 4/4 [00:04<00:00,  1.19s/it]
              all        128        929      0.741      0.574      0.669       0.46
           person        128        254      0.817      0.669      0.789      0.521
          bicycle        128          6      0.776      0.586      0.627      0.388
              car        128         46      0.659       0.37      0.481      0.229
       motorcycle        128          5      0.758      0.632       0.88      0.687
         airplane        128          6          1      0.823      0.995      0.789
The overall precision 0.741 seems acceptable for our practice. We are now ready to run the pipeline again with more training epochs and to visualize the results.
Note
The actual results you get may slightly differ.
Visualize the YOLOv5 Results
Increase the training epochs:
Back to the run list by clicking on the link on the top.
Go to the action list by clicking on the ACTIONS button.

Click on the train model action and increase the epoch number from 10 to 20. The complete commands:
apt-get update && apt-get install -y libgl1-mesa-glx
pip uninstall -y typer
pip install -qr requirements.txt
python train.py --img 640 --batch 16 --epochs 20 --data coco128.yaml --weights yolov5s.pt --cache
Click on the UPDATE button.
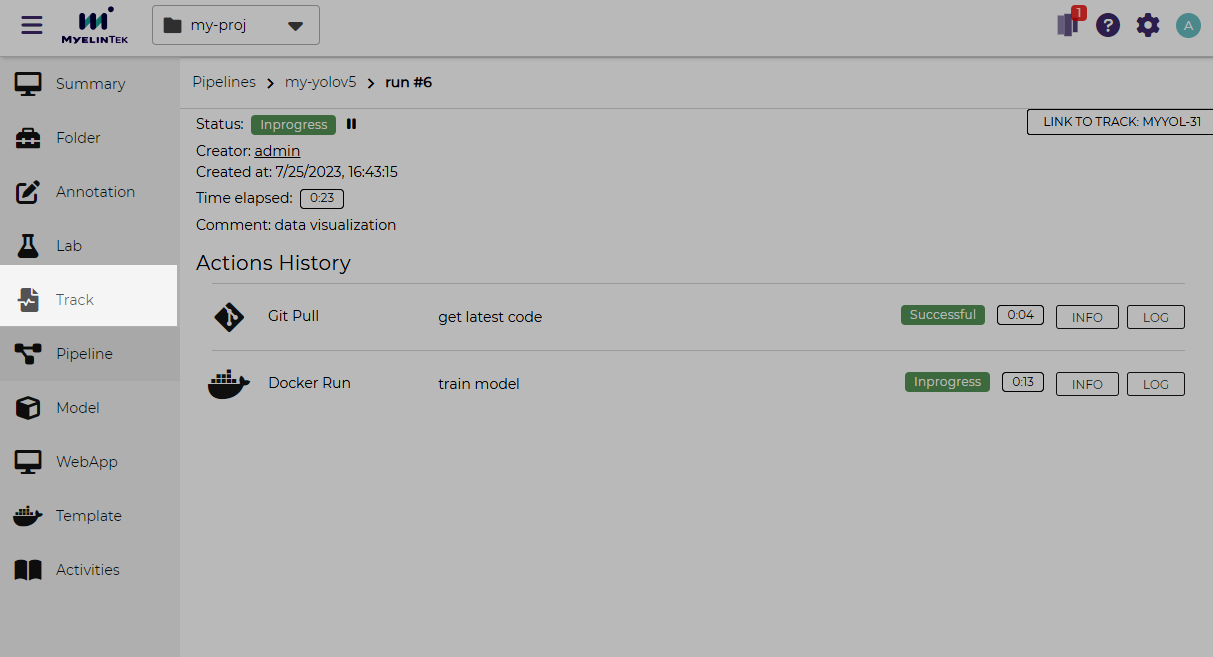
Then, we run the pipeline again. But at this time, we enable track to keep and visualize the results.
Click on the RUN PIPELINE button.
Toggle on Use Track.
Click on the RUN NOW button.
Note
Track is a mechanism to keep track of the results, which avoids the trained results being overwritten by succeeding pipeline runs. It also enables visualizing the results data. More details could be found in the track documentation.
Be patient and wait until the run is finished.
Let’s see our training results:
Go to the track listing page by clicking on the Track item in the left menu.
Go to the track details page by clicking on the corresponding track link in the list.
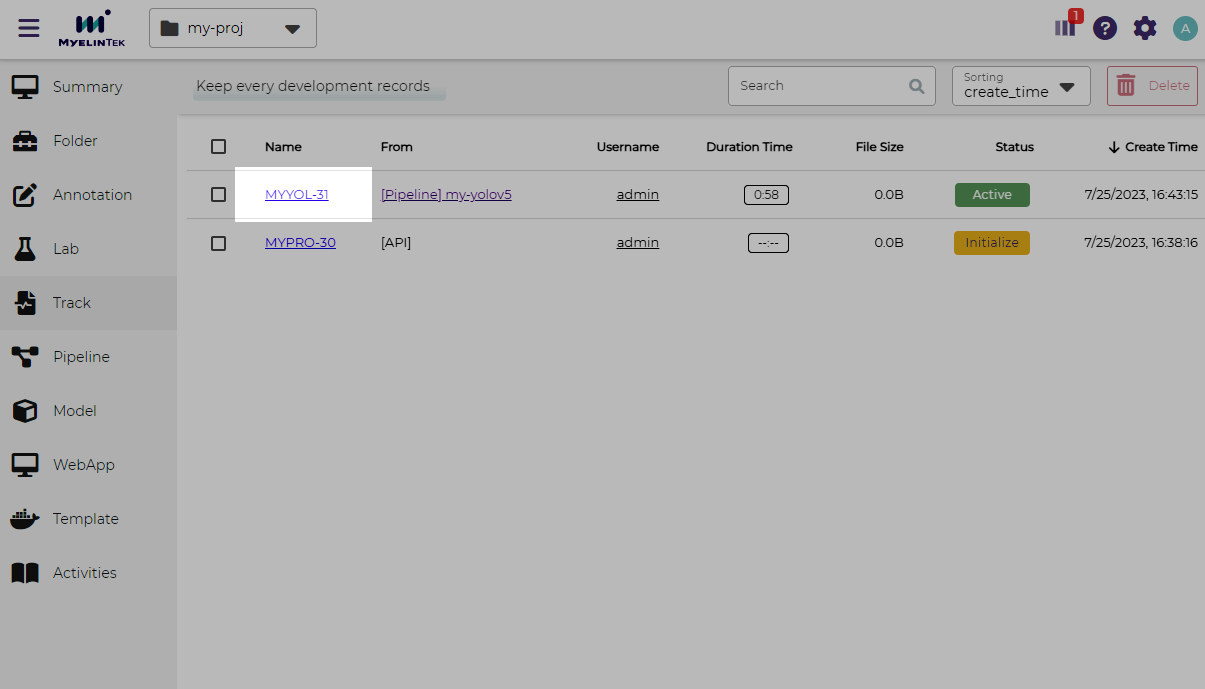
Note
A track is named by the initial part of the project name, followed by the run number.
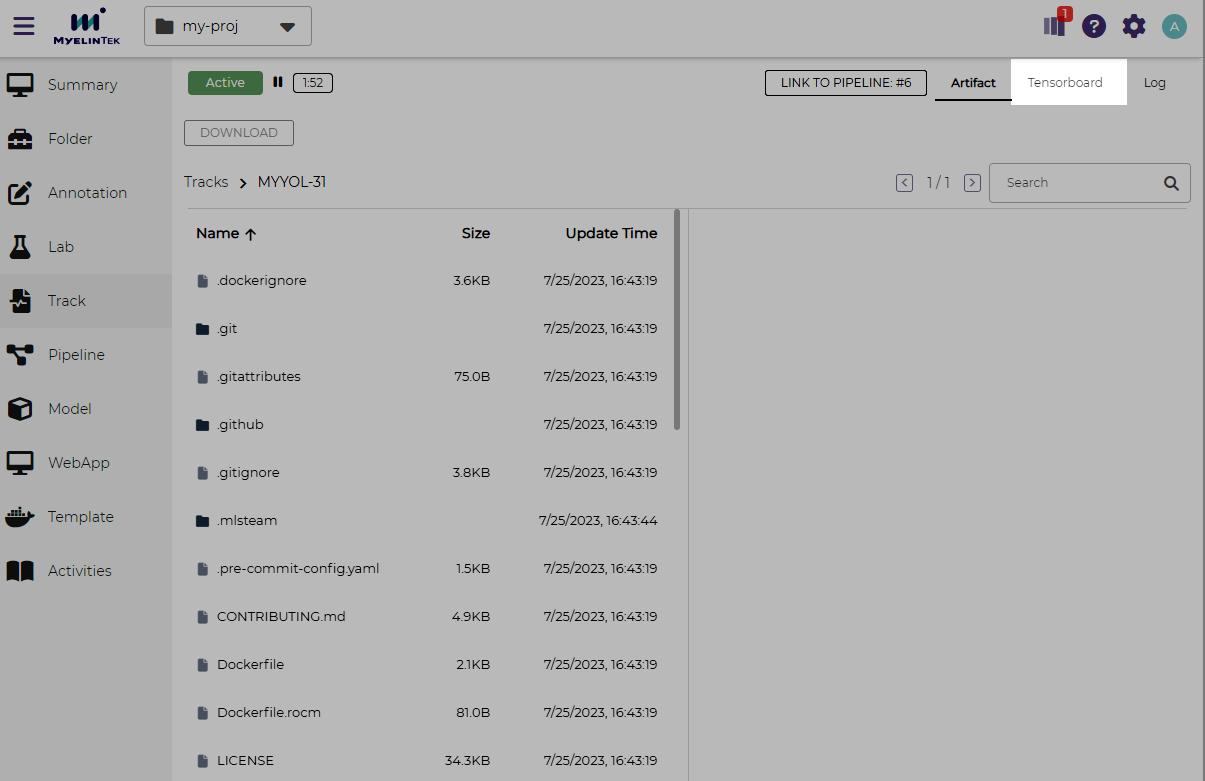
In the track details page, click the TENSORBOARD button in the top-left corner. TensorBoard will show up in a few seconds.
Now, we could see various logged data displayed in various figures.
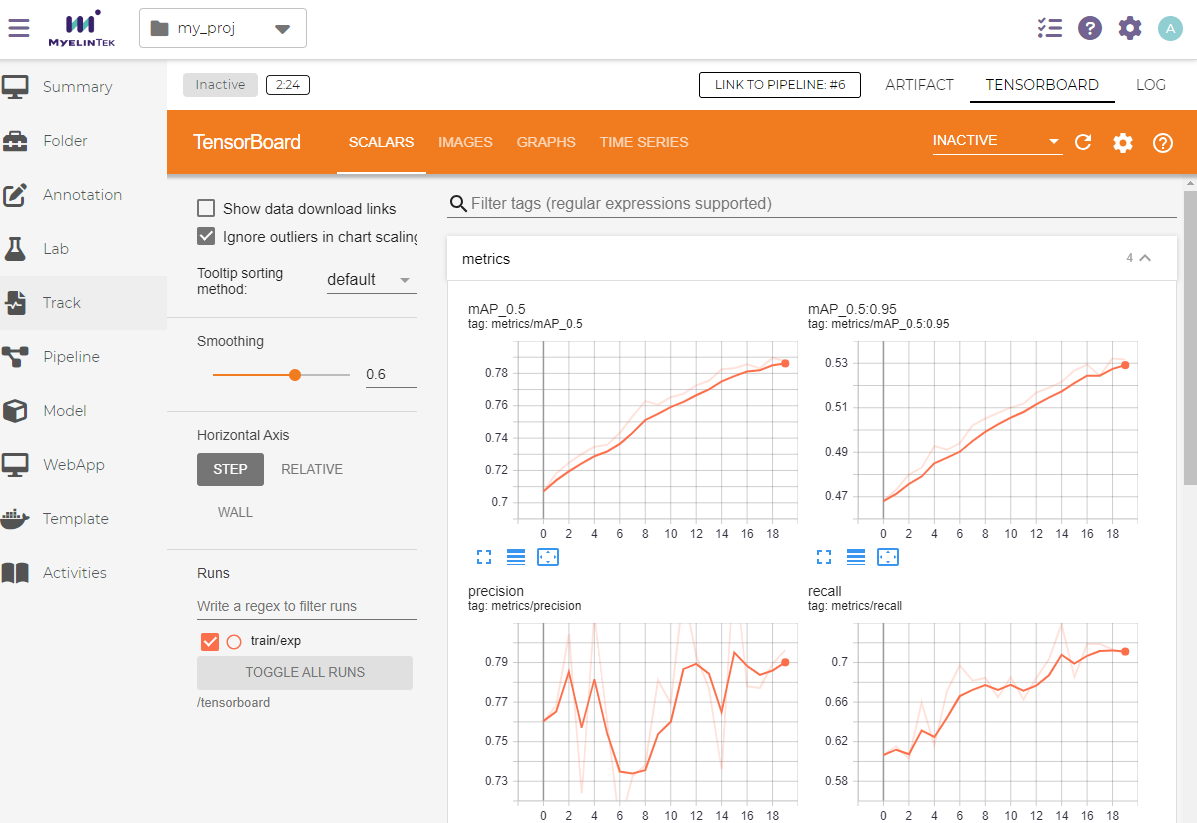
Note
Refer to the TensorBoard Website for visualization operations.